Pressure-Volume (PV) loops: Overview and Applications
Blog post by Jasmin Skinner
Often considered the gold standard of cardiac measurement, pressure-volume loops (PV loops) are indispensable for cardiologists, cardiovascular researchers, bio-engineers, and a wide range of other professionals and students (Arvidsson et al., 2023). Despite the numerous applications of PV loops, limited educational resources are available to provide accurate information for a diverse variety of use cases. Whether you’re preparing for the next presentation, or just refamiliarizing yourself with theory before your next cardiology conference, this article will explain what PV loops are, when they’re used, some limitations, and some real-world case studies illustrating how the PV loop has enabled breakthroughs in scientific research.
What are PV Loops?
Put simply, pressure-volume loops are two-dimensional graphs, illustrating the relationship between pressure and volume in the area of study. Traditionally, the data for these graphs were obtained using a pressure-volume catheter or a similar device placed directly within the left or right ventricle of the heart (Arvidsson et al., 2023). However, many non-invasive procedures have been developed to reduce the need for catheterization. For example, Arvidsson et al. recently demonstrated that cardiovascular magnetic resonance and brachial cuff blood pressure data can yield accurate and precise PV loops (Arvidsson et al., 2023). Once a PV loop data has been plotted, five main phases are observed, each of which is described more thoroughly in the box below. The following explanation is based on a typical left-ventricular PV loop.
Diastolic Filling (Bottom of Loop): As the ventricle relaxes, it fills with blood from the atrium. The volume increases, but the pressure remains relatively low.
Isovolumetric Contraction (Vertical Line Upwards): After the atrioventricular valve closes and before the aortic valve opens, the ventricle contracts without ejecting any blood (volume stays constant). The pressure rises steeply during this phase.
Ejection Phase (Sloping Line Upwards to the Right): The aortic valve opens, and blood is ejected into the aorta. The volume decreases as blood is pumped out, and the pressure remains high but may decrease somewhat toward the end of ejection.
Isovolumetric Relaxation (Vertical Line Downwards): After ejection, the aortic valve closes, but the atrioventricular valve has not yet opened. The ventricle relaxes, and the pressure drops rapidly while the volume remains constant.
Return to Diastolic Filling (Closing the Loop): The atrioventricular valve opens again, and the cycle repeats.
Why Use PV Loops?
Pressure-volume loops serve to measure a range of cardiac parameters, most notably stroke volume, cardiac output, ejection fraction, and myocardial contractility. These parameters can give insight into heart and myocardial function, inform a particular diagnosis based on a predetermined set of abnormalities, and characterize novel cardiac disease states and phenotypes. This method of hemodynamic measurement typically builds upon other complementary and less invasive parameters, such as echocardiography (ECG), with PV loops providing a clear graphical representation of heart function (Lindsey et al., 2018). Certain disease states yield different PV loop shapes or patterns, including a number of commonly studied myocardial disorders, as displayed below.
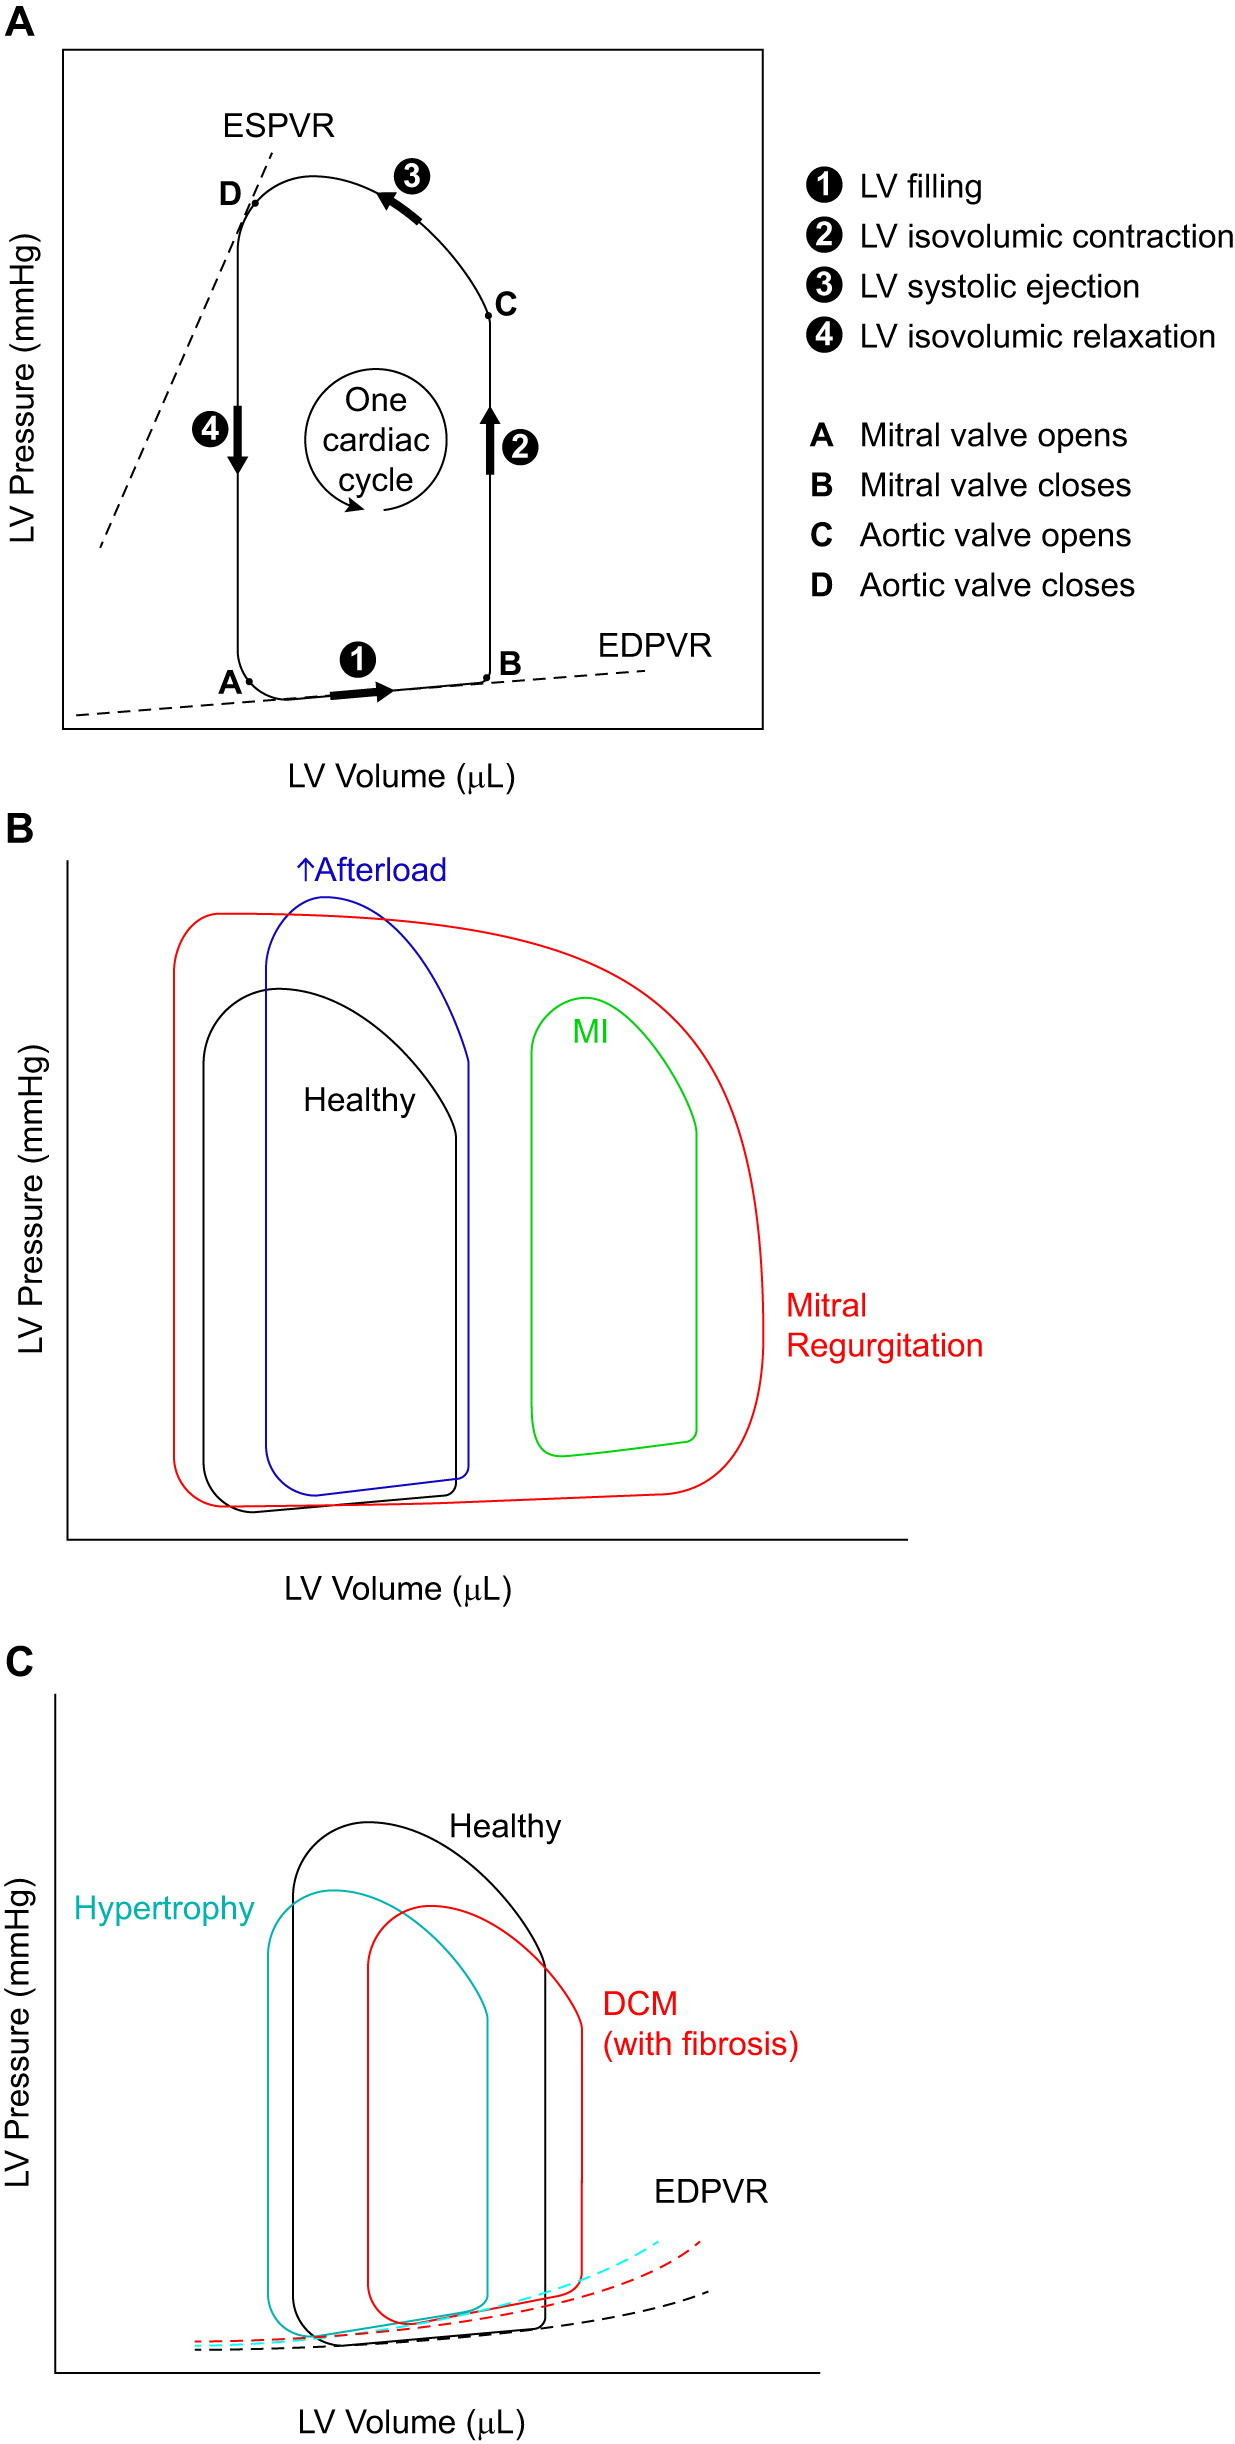
Figure 2 from Lindsey et al., 2018. “Illustrations of pressure-volume (P-V) loops and how they are altered in heart disease. A: P-V loops representing the changes in pressure and volume of the left ventricle (LV) during one cardiac cycle. Information in LV pressure and volume during different phases of a cardiac cycle can be obtained from this loop as indicated. B: the shape and relative location of the P-V loop are affected differently in various types of heart diseases. In mitral regurgitation, the width of the P-V loop does not represent the stroke volume, because not all of the blood is pumped out of the LV, due to the regurgitant mitral valve. The mitral regurgitation is also responsible for the absence of a true isovolumic relaxation or contraction. C: end-diastolic P-V relationship (EDPVR) can serve as a measure of myocardial stiffness (of the LV). A steeper slope for this curve correlates with increased stiffness (reduced compliance) of the LV myocardium. ESPVR, end-systolic pressure-volume relationship; DCM, dilated cardiomyopathy.”
How are PV loops used?
Preclinical applications of PV loops typically aim to resolve or further characterize a particular disease state by determining characteristic abnormalities in heart muscle function. These real-time representations of the pressure-volume relationships within the heart chambers are often used in conjunction with other analyses of function. For example, a 2020 study from Corporan et al. characterized early left ventricular dysfunction in a preclinical model of severe mitral regurgitation – an irregularity in heart valve function that results in a backwards flow of blood in the heart. In this research, PV loops proved invaluable, as the real-time changes in volume and pressure could not otherwise be observed or visualized.
Within clinics, this methodology is often used to assess some measure of cardiac or myocardial function, providing real-time insights about the dynamics of volume within the left or right ventricle. This can provide invaluable diagnostic and therapeutic information, allowing clinicians to identify abnormalities or guide future treatment plans. A recent paper from Sarraf et al. discusses the first-in-man-four-chamber pressure volume analysis during aortic valve replacement, highlighting the important health monitoring capabilities of this simple technique. Additionally, pressure-volume loops can also be used to optimize drug delivery of beta-blockers (Katz, 1988) and other heart-related medications such as inotropes, and provide feedback on the performance of an implanted system, such as a ventricular assistive device (VAD), within a patient (Brenner et al., 2020).
For additional information about hemodynamic function and cardiovascular sciences, explore our content library by clicking HERE.
Limitations of PV loops
While pressure-volume loops can be very useful, they also have certain inherent limitations. As PV loops only represent a snapshot of the cardiac cycle, they can only provide information about heart function during the testing period. Additionally, the interpretation of pressure-volume loops relies on particular assumptions about heart function and compliance which may not always hold in all disease states, and may not always be practical to obtain. Real-time pressure can only be obtained through invasive catheterization, whereas volume can be measured using non-invasive imaging techniques (Seemann et al., 2019). Myocardial and cardiac dysfunction typically arise from a dysregulation of a variety of muscle fibers and physiological processes, and therefore PV loops are not a foolproof diagnostic tool. They are a complementary measurement technique best used in conjunction with other methods, and remain a valuable tool for preclinical and clinical researchers and physicians.
Conclusion
Pressure-volume loops have proven indispensable since their widespread adoption across biomedical fields. While this article does not provide a comprehensive and detailed examination of PV loops, it aims to enhance the interpretation and understanding of these graphical representations of cardiac function by outlining their significance and application.
About the Author
About the Author

Jasmin Skinner is an undergraduate student at the University of Western Ontario completing a Specialization in Biology and a Minor in Chemistry, with focused interest in applying these concepts to environmental conservation. As a lover of the outdoors and the arts, much of her time is spent in nature and within the local London art community, creating and connecting with all walks of life. After graduating, she hopes to continue her passion of finding unconventional solutions to environmental issues by working with nature, not against it.
References
- Arvidsson, P. M., Green, P. G., Watson, W. D., Shanmuganathan, M., Heiberg, E., De Maria, G. L., Arheden, H., Herring, N., & Rider, O. J. (2023). Non-invasive left ventricular pressure-volume loops from cardiovascular magnetic resonance imaging and brachial blood pressure: Validation using pressure catheter measurements. European Heart Journal – Imaging Methods and Practice, 1(2). https://doi.org/10.1093/ehjimp/qyad035
- Brener, M. I., Burkhoff, D., Basir, M. B., & Alqarqaz, M. (2020). Pressure-volume analysis illustrating left ventricular unloading by a percutaneous transvalvular left ventricular to aortic pump. Circulation: Heart Failure, 13(4). https://doi.org/10.1161/circheartfailure.119.006788
- Corporan, D., Onohara, D., Amedi, A., Saadeh, M., Guyton, R. A., Kumar, S., & Padala, M. (2021). Hemodynamic and transcriptomic studies suggest early left ventricular dysfunction in a preclinical model of severe mitral regurgitation. The Journal of Thoracic and Cardiovascular Surgery, 161(3). https://doi.org/10.1016/j.jtcvs.2020.08.119
- Katz, A. M. (1988). Influence of altered inotropy and lusitropy on ventricular pressure-volume loops. Journal of the American College of Cardiology, 11(2), 438–445. https://doi.org/10.1016/0735-1097(88)90113-1
- Lindsey, M. L., Kassiri, Z., Virag, J. A., de Castro Brás, L. E., & Scherrer-Crosbie, M. (2018). Guidelines for measuring cardiac physiology in mice. American Journal of Physiology-Heart and Circulatory Physiology, 314(4). https://doi.org/10.1152/ajpheart.00339.2017
- Sarraf, M., Burkhoff, D., & Brener, M. I. (2021). First-in-man 4-chamber pressure–volume analysis during transcatheter aortic valve replacement for bicuspid aortic valve disease. JACC: Case Reports, 3(1), 77–81. https://doi.org/10.1016/j.jaccas.2020.11.041
- Seemann, F., Arvidsson, P., Nordlund, D., Kopic, S., Carlsson, M., Arheden, H., & Heiberg, E. (2019). Noninvasive quantification of pressure-volume loops from brachial pressure and cardiovascular magnetic resonance. Circulation: Cardiovascular Imaging, 12(1). https://doi.org/10.1161/circimaging.118.008493